
Update: This article was last updated on 12th January 2026 to reflect the accuracy and up-to-date information on the page.
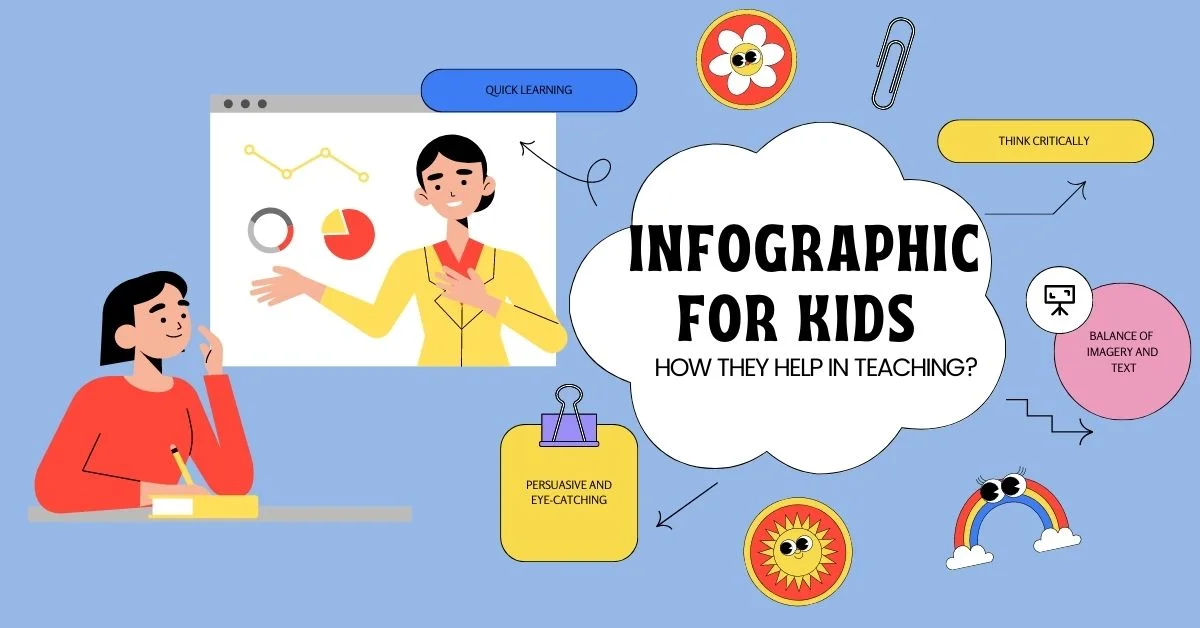
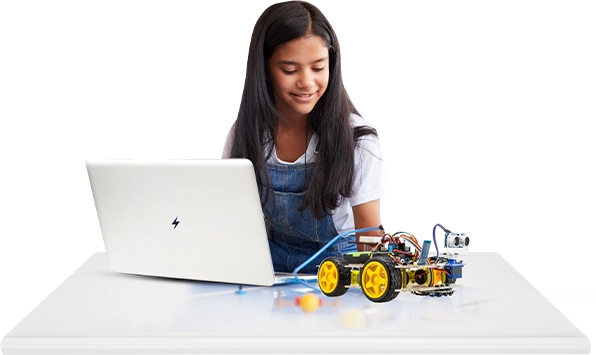
By now, every teacher and professor is aware of the fact that visual learning is the most effective kind of learning as it is easy to learn and memorize. Therefore, they are a favored mode of learning and teaching in schools all around the world. An infographic for kids can be a very useful tool for enriching their learning experience.
According to a study by the European Journal of Cognitive Psychology, a person is likely to recall 65% of information if it is given in a visual format. In contrast, the same information recalled from hearing or text is just 10%.
Recommended reading: AI for Kids: What You Need to Know
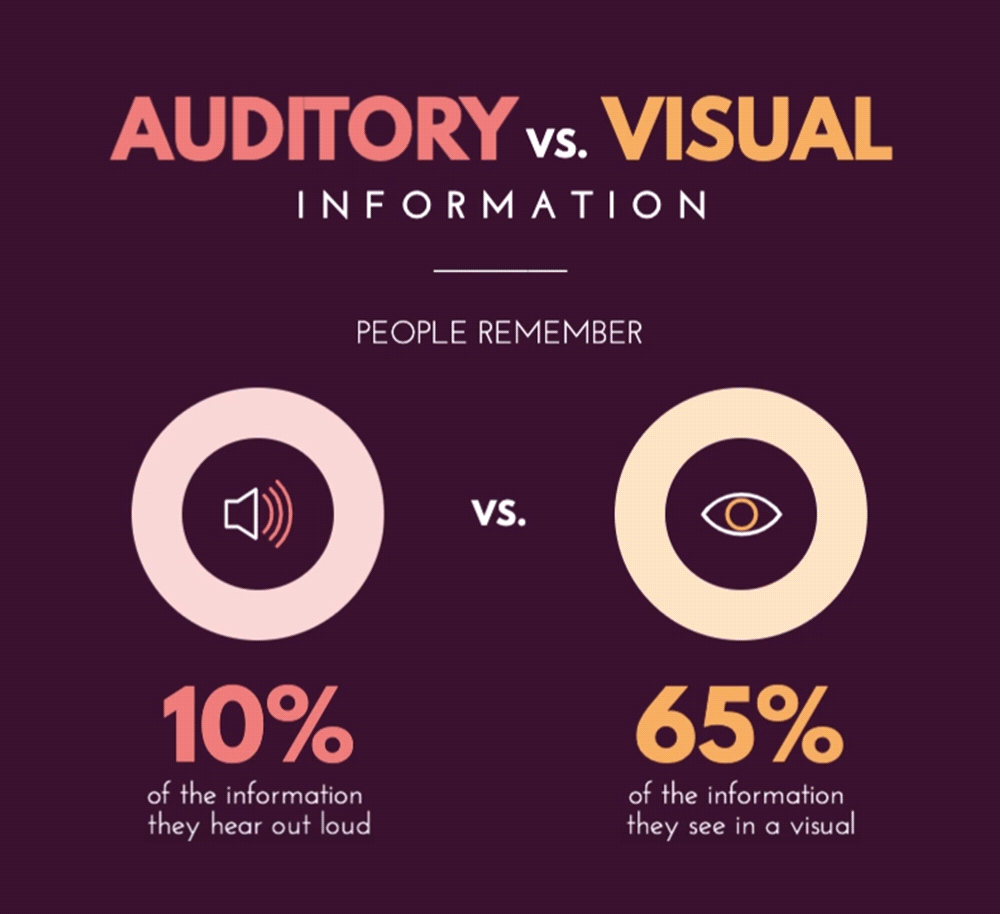
Source: Visme
Infographics are used to visually represent any form of complex data, information, or ideas that use charts, graphs, icons, images, and other visual elements to convey a message more effectively and efficiently. Infographics for kids can help them understand complex information in a more simplified and appealing way.
Infographics can be represented in different ways that may contain statistical charts, diagrams, timelines, flowcharts, and maps. They may also contain text, headings, captions, and labels to supplement the information being provided.
Learn more about this: Infographics Archives
Infographics can be an effective teaching aid for children since they represent information in a highly engaging and accessible manner. Some of the ways through which infographics can benefit children in teaching are as follows:
1. Visual Representation
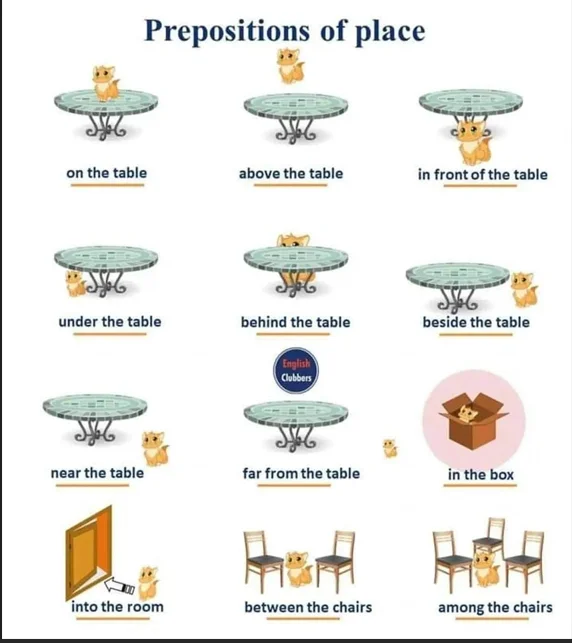
Source: English Grammar
Teachers can make complex concepts look simple and clear by adding visuals and text while teaching their students in schools. Using visually appealing techniques such as adding colors, images, and charts along with textual references can make abstract ideas more concrete and easier to grasp. Infographic definition for kids refers to presenting information in a visual format that helps children understand concepts more easily.
2. Enhanced Retention
Children respond better to pictorial material if it is vibrant, creative, and appealing to the eye. Best infographics early childhood makes learning more enjoyable and entertaining and helps children remain focused and remember things.
Infographics can help kids remember information more efficiently because they engage both the visual and verbal parts of the brain. This can lead to better retention and understanding of key concepts.
Recommended reading: Explaining Big Data to Kids – A Practical Guide
3. Improved Communication
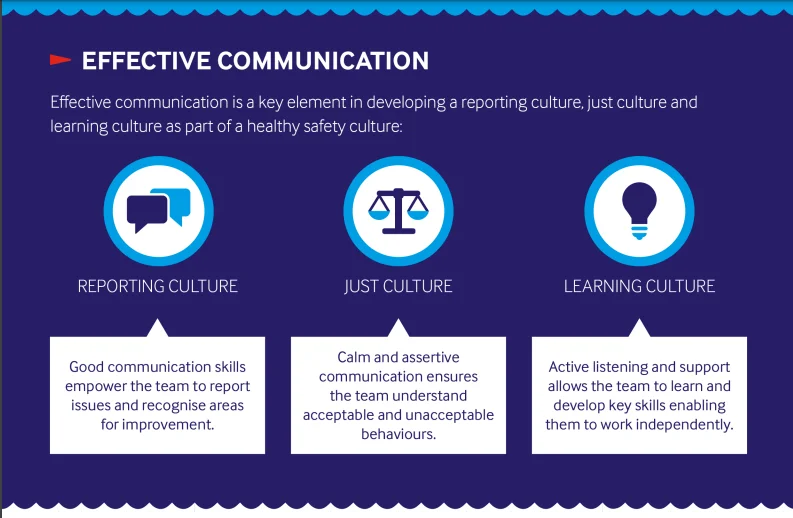
Communication between the students and teachers is enhanced when teachers present complex concepts and information in a way that is simplified and easy to understand. Techniques which use visual aids and graphics will help teachers to understand information that kids find it difficult to understand.
Moreover, infographics can help kids develop better communication skills by teaching them how to present information in a clear, concise, and visually appealing way. This is a valuable skill that can be applied to many different contexts.
4. Creativity
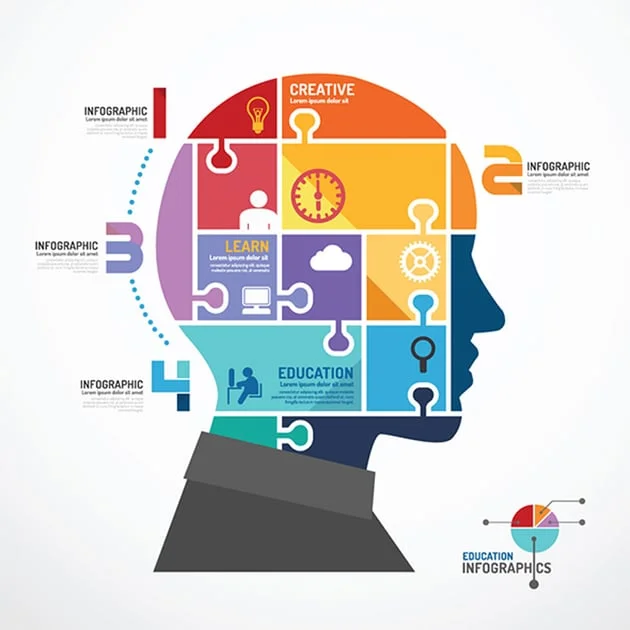
Infographics can make students let their creative side out by giving them a platform to design and create visual representations of information. It allows them to express themselves in new and exciting ways. This can be a fun and rewarding way to learn and develop new skills.
Recommended Reading:The Silver Lining of Failure: 5 Things Kids Can Learn
5. Interactive Learning

Infographics can be used as an interactive learning tool, allowing kids to explore data, statistics, and other information in a more engaging way. This can help kids stay interested and motivated in the learning process. Moreover, students can grow their memory through infographics as concepts are presented to them in a visual format.
Types of Infographics
There are various types of infographics that can help kids learn faster. Some of them include the following:
1. Educational Posters
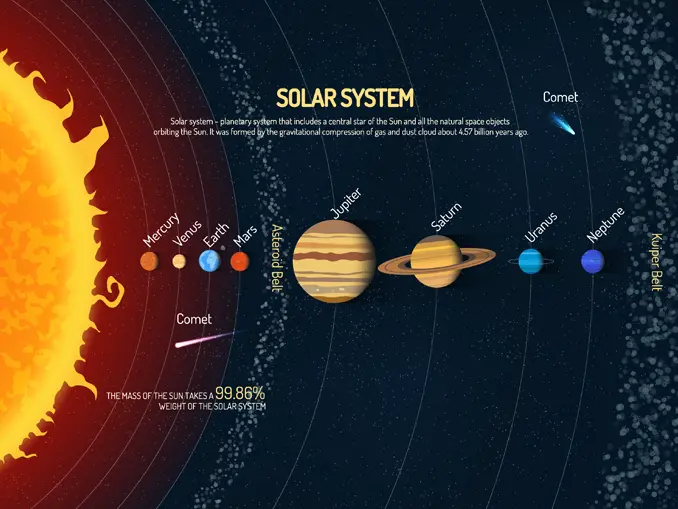
This type of infographic is used to teach kids about various subjects, such as science, history, or geography. What is an infographic for kids? Educational posters typically feature a visual representation of key concepts, along with short text that explains the concept in depth.
For example, a poster of a c teaches students about the different planets, orbits, galaxy, satellites and their characteristics, and their position in the solar system.
Source: EarthHow
2. Timeline Infographics
A timeline infographic typically shows a timeline progression and is an interesting way of teaching kids about subjects like history. These infographic examples for families help students learn about historical events or the order of events in a period. Say, for example, you are teaching students about ‘The American Revolution,’ you can use infographics to feature a timeline highlighting all the important dates and events between 1763 – 1783.
Recommended Reading:Graphic Design for Kids- All You Need to Know
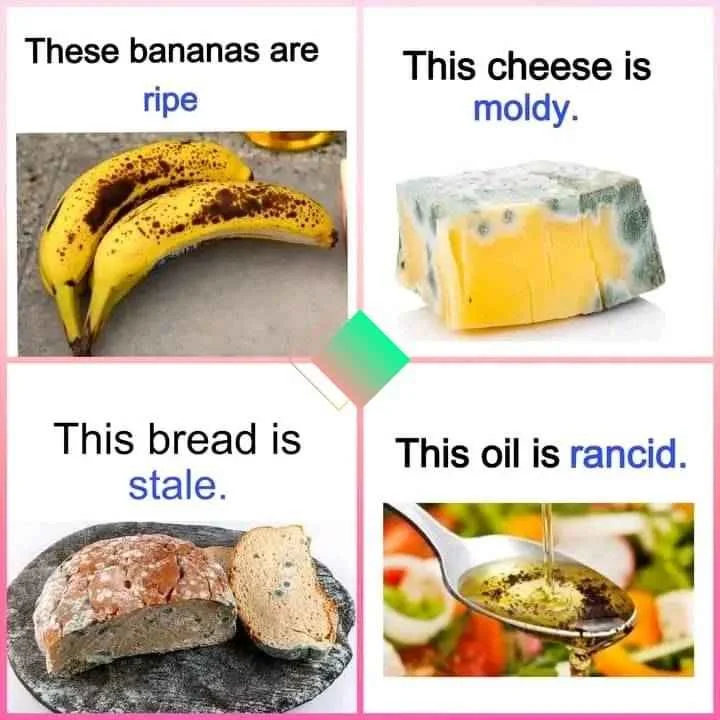
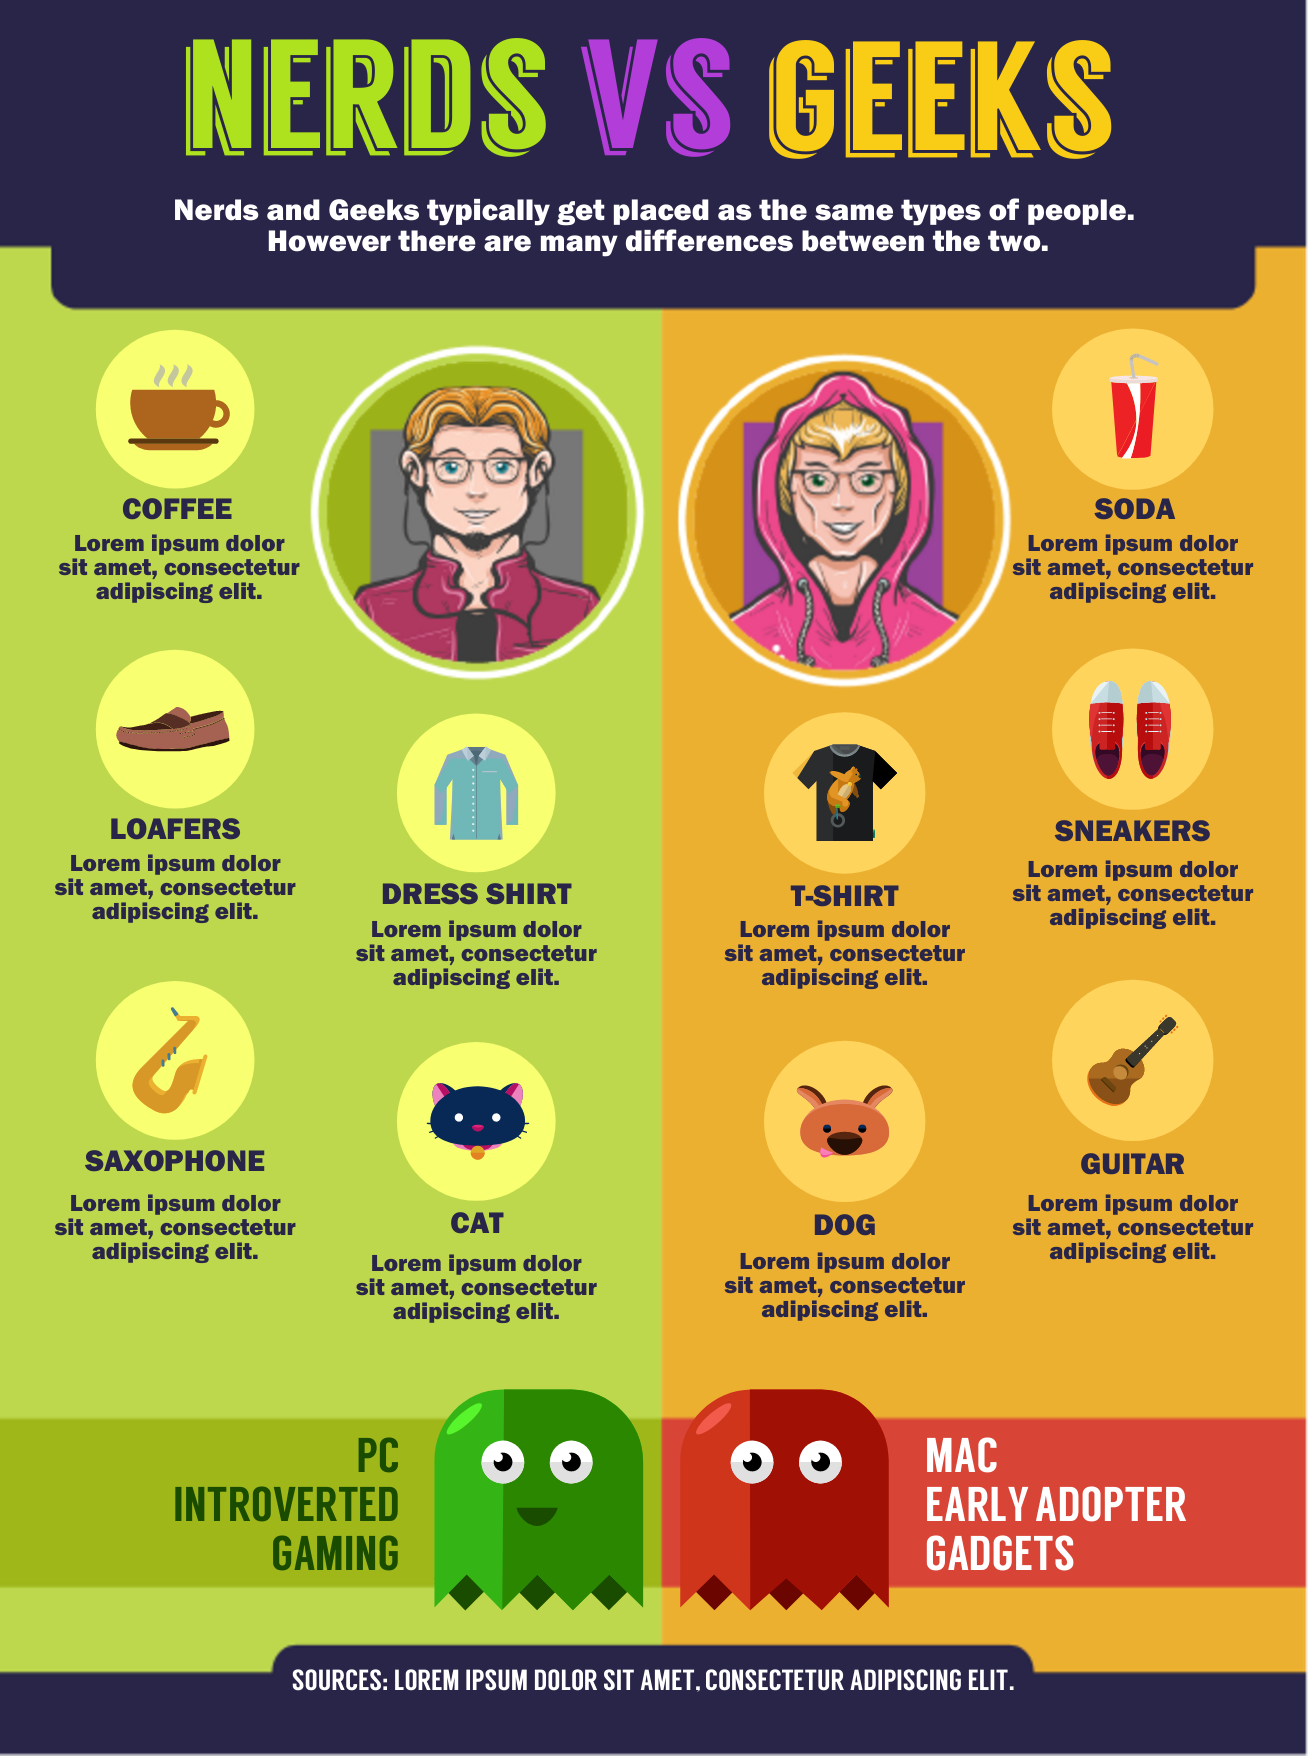
3. Comparison Infographics
Comparison infographics are a blend of images and words that helps students learn to compare and contrast two or more things, like comparing various kinds of animals, or different nations or characteristics between two different pupils. Most process infographics represent a side-by-side comparison of key features. This is evidence that infographics are very relevant in school. They make learning complex concepts through images much more effective.
Source: Easel
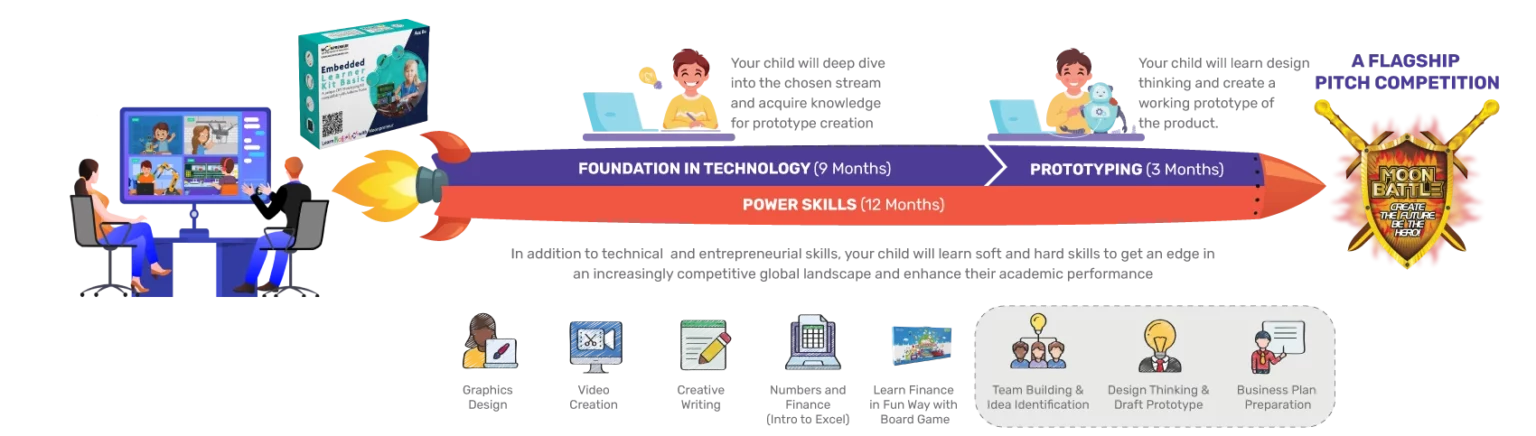
4. Process Infographics
Process infographics could be used in explaining various processes to kids. For instance, the lifecycle of a butterfly or the process of photosynthesis by listing down the steps involved in it in sequential order. In these infographics, there are usually images describing each step in detail through the use of words.

5. Data-driven Infographics
Data-driven infographics can be used to teach kids about statistics and data analysis. These infographics usually include charts, graphs, and other visual representations of data, along with text that explains the information in more detail.
Recommended reading: Personal Finance For Kids – What You Should Know?
Conclusion
All in all, infographics have become very popular in the past few years because they enhance the educational experience because help in improving communication between teachers and students. This modern-age tool is particularly useful for representing data-driven information, such as statistics, survey results, or research findings, in a way that is easy to understand and visually appealing. Teachers should encourage their students to use infographics to present information concisely and stay engaged and motivated in the learning process.
Moonpreneur is on a mission to disrupt traditional education and future-proof the next generation with holistic learning solutions. Its Innovator Program is building tomorrow’s workforce by training students in AI/ML, Robotics, Coding, IoT, and Apps, enabling entrepreneurship through experiential learning.


How can students be inspired to be creative using infographics?
By giving kids a platform to develop and create visual representations of knowledge, infographics foster creativity in them. Students can express themselves in novel and engaging ways as a result, which makes studying enjoyable and fulfilling.
How may an interactive learning tool like an infographic be used?
Using infographics as an interactive learning tool, children may examine facts, statistics, and other information in a fun and interesting way. By using visual aids to improve memory recall, this interactive teaching method keeps students engaged and motivated throughout the learning process.
Infographics, however, have shortcomings. More resources and rigorous analysis are required in light of oversimplification and possible misrepresentation. Interactive exercises and screen-free techniques must be used in balance to prevent screen dependency and passive learning. Alternative format requirements are highlighted by accessibility issues for specific learners.