Update: This article was last updated on 13th January 2026 to reflect the accuracy and up-to-date information on the page.
Category: Calculator portion, Multiple Choice
Question 10: The world’s population has grown at an average rate of 1.9 percent per year since 1945. There were approximately 4 billion people in the world in 1975. Which of the following functions represents the world’s population P, in billions of people, t years since 1975?
A)
B)
C)
D)
Ans. The world’s population has been growing consistently at an annual rate of 1.9% since 1945. This means it has been increasing by a constant factor of 1.019 each year since 1945. Choice A is the correct answer. This is because the world’s population has been consistently growing at an average annual rate of 1.9% since 1945. This means it has been increasing by a constant factor of 1.019 each year since 1945.To estimate the world’s population in different years, we can use this constant growth factor. For example, if the world’s population was approximately 4 billion in 1975, then in 1976, it would have been about 4 multiplied by 1.019. In 1977, it would be 4 multiplied by 1.019 squared (1.019^2), and so on.
Therefore, we can represent the world’s population, denoted as P(t), t years since 1975 with the function P(t) = 4(1.019)^t.
Choices C and D are incorrect because they propose linear models, which do not account for the constant exponential growth observed in the world’s population.
Choice B is also incorrect because it suggests a 90% increase in population each year, which does not align with the consistent 1.9% growth rate.
Recommended reading: 20 Hardest SAT Math Questions You Must Try
A) 12
B) 15
C) 20
D) 22
Ans. The correct option is C)
To find the area of a rectangle, we use the formula: Area = Length × Breadth.
Let A1 = L1 × B1, where L1 and B1 are the length and breadth of the original rectangle.
Given that L2 = 10% + L1 = 1.1L1, and B2 = B1 – (100/100)B1 = (100/100 – p)B1, we have:
A2 = 0.88A1.
This equation can be expanded as:
L2 × B2 = 0.88(L1 × B1),
1.1L1 × ((100/100 – p)B1) = 0.88(L1 × B1).
Now, simplify further:
1.1 × (100B1 – pB1) = 0.88(L1 × B1),
110B1 – 1.1pB1 = 0.88(L1 × B1).
Rearrange the terms:
110B1 – 1.1pB1 = 0.88(L1 × B1),
22B1 = 1.1p.
Now, solve for p:
22B1 = 1.1p,
p = 20.
So, the value of p is indeed 20.
Choice A is not the correct answer and could be due to a confusion between the 12 percent decrease in area and the percent decrease in width.
Choice B is also incorrect because reducing the width by 15 percent leads to a 6.5 percent decrease in area, not the 12 percent decrease observed.
Choice D is not the right answer and might be a result of adding the percentages provided in the question (10 + 12).
Recommended reading: 10 World’s Hardest Math Problems With Solutions and Examples That Will Blow Your Mind
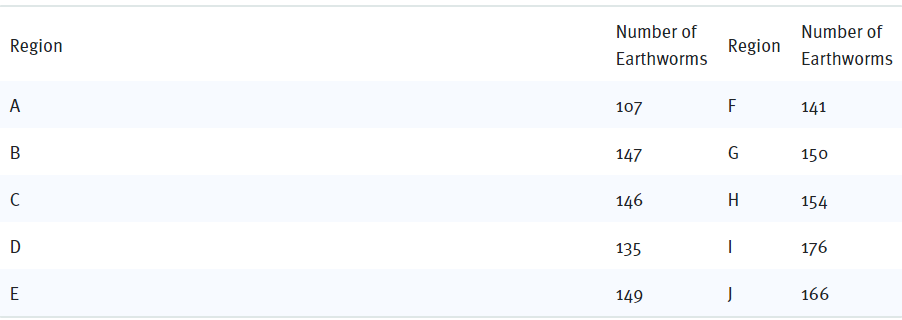
Question 12: A square field measures 10 meters by 10 meters. Ten students each mark off a randomly selected region of the field; each region is square and has side lengths of 1 meter, and no two regions overlap. The students count the earthworms contained in the soil to a depth of 5 centimeters beneath the ground’s surface in each region. The results are shown in the table below.
Which of the following is a reasonable approximation of the number of earthworms to a depth of 5 centimeters beneath the ground’s surface in the entire field?
A) 150
B) 1,500
C) 15,000
D) 150,000
Ans. We have a square field with a side length of 10 meters. Within this field, there is a smaller square region with a side length of 1 meter.
To estimate the total number of earthworms in the entire field, we consider that there are 100 such smaller square regions (10×10 grid) within the larger square field.
Since we have the analysis data available for 10 of these smaller regions, we can use this information to approximate the total number of earthworms in the entire field.
To do this, we multiply the total number found in these ten regions by 10 to estimate the total number of earthworms in the field.
We then sum up the numbers obtained from these ten regions:
107 + 147 + 146 + 135 + 149 + 141 + 150 + 154 + 176 + 166 = 1471
Finally, we multiply the sum by 10 to get an approximation of the total number of earthworms:
1471 × 10 = 14710, which can be approximated to about 15000.
Recommended reading: How Many Questions Are on the SAT? 2025 Update
Question 13: Of the following four types of savings account plans, which option would yield exponential growth of the money in the account?
A) Each successive year, 2% of the initial savings is added to the value of the account.
B) Each successive year, 1.5% of the initial savings and $100 is added to the value of the account.
C) Each successive year, 1% of the current value is added to the value of the account.
D) Each successive year, $100 is added to the value of the account.
Ans. Choice C is the correct answer. This is because it describes exponential growth.
Exponential growth is characterized by an increase of a quantity at a relative rate, meaning it increases by the same factor over equal increments of time. In this case, the value of the account increases by 1% each year, which means it is multiplied by the same factor, 1.01, each year. This is a clear indication of exponential growth.
On the other hand: Choices A and B are incorrect because they describe linear growth, where the rate depends only on the initial value, resulting in the value increasing by the same amount each year. Choice D is also incorrect as it represents linear growth, where the increase is constant each year.
Recommended reading: An overview of the SAT Math Test Sections
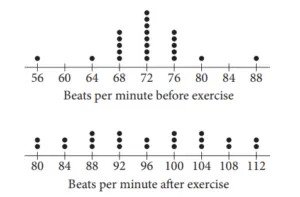
Question 14: The 22 students in a health class conducted an experiment in which they each recorded their pulse rates, in beats per minute, before and after completing a light exercise routine. The dot plots below display the results.
Let s1 and r1 be the standard deviation and range, respectively, of the data before exercise, and let s2 and r2 be the standard deviation and range, respectively, of the data after exercise. Which of the following is true?
s1 = s2 and r1 = r2
s1 < s2 and r1 < r2
s1 > s2 and r1 > r2
s1 ≠ s2 and r1 = r2
Ans. Choice D is the correct answer. This is because the two data sets have the same range, which is 32.
Here’s an explanation of why Choice D is correct:
The first data set has a range of 88 – 56 = 32.
The second data set also has a range of 112 – 80 = 32.
The fact that both data sets have the same range is a clear indicator that Choice D is the correct answer.
Additionally, you can visually observe that the ranges are the same because the two dot plots are aligned, have the same scales, and the graphs have the same width. However, it’s important to note that the two data sets have different standard deviations. The first dot plot shows most values clustered near the mean, while the second dot plot shows most values farther from the mean. Therefore, the standard deviations of the two data sets are not equal, and this is why Choices A, B, and C are incorrect. In summary, Choice D correctly identifies that the two data sets have the same range but different standard deviations, while the other choices make incorrect assertions about the standard deviations and ranges.
Recommended reading: Assess Your Skills with Moonpreneur’s SAT Mock Test.
Question 15: If (ax+2)(bx+7)=15x^2+ cx+14 for all values of x, and a+b=8, what are the two possible values for c?
A) 3 and 5
B) 6 and 35
C) 10 and 21
D) 31 and 41
Ans. The correct option is D.
Here’s a systematic breakdown of the solution:
We start with the equation (ax + 2)(bx + 7) = abx^2 + 7ax + 2bx + 14.
We observe that this equation is equal to 15x^2 + cx + 14.
Equating the coefficients of corresponding terms, we get the following equations:
ab = 15 (from the x^2 terms)
7a + 2b = c (from the x terms)
We are also given that a + b = 8.
From equations (1) and (2), we can deduce that either ‘a’ or ‘b’ is equal to 3, and the other is equal to 5.
When a = 3 and b = 5, we calculate ‘c’ as follows: c = 7(3) + 2(5) = 21 + 10 = 31.
When a = 5 and b = 3, we calculate ‘c’ as follows: c = 7(5) + 2(3) = 35 + 6 = 41.
So, there are two possible sets of values for ‘a’, ‘b’, and ‘c’: (3, 5, 31) and (5, 3, 41).
Once you’ve completed these exercises, it’s a good idea to pause and reflect on your experience. If you find these problems challenging or feel overwhelmed, it may indicate that you need some additional study and practice. You can consider referring to resources like the College Board’s SAT Study Guide or our article on essential SAT math formulas for extra support.
On the other hand, if you found these problems relatively easy and tackled them with confidence, congratulations! It’s evident that you have a strong grasp of math. You might want to shift your focus to other aspects of SAT preparation, such as building your SAT vocabulary. Regardless of where you stand, remember that consistent studying and practice will lead to success. Best of luck with your SAT preparation journey!
Moonpreneur understands the needs and demands this rapidly changing technological world is bringing with it for our kids. Our expert-designed Advanced Math course for grades 3rd, 4th, 5th, and 6th will help your child develop math skills with hands-on lessons, excite them to learn, and help them build real-life applications.
Register for a free 60-minute Advanced Math Workshop today!


