

Update: This article was last updated on 8th January 2026 to reflect the accuracy and up-to-date information on the page.
When diving into the world of data analysis, you will frequently encounter two important concepts: parameters and statistics. Understanding these terms is critical for anyone working with data, whether in research, business, or everyday decision-making. They form the foundation of how we interpret data, draw conclusions, and make informed decisions. In this blog, we will explore the key differences between a parameter and a statistic, their importance, and how they are applied in practice.
Recommended Reading: Making the Most of Grade 9 – 10 Tips
What Is a Parameter?
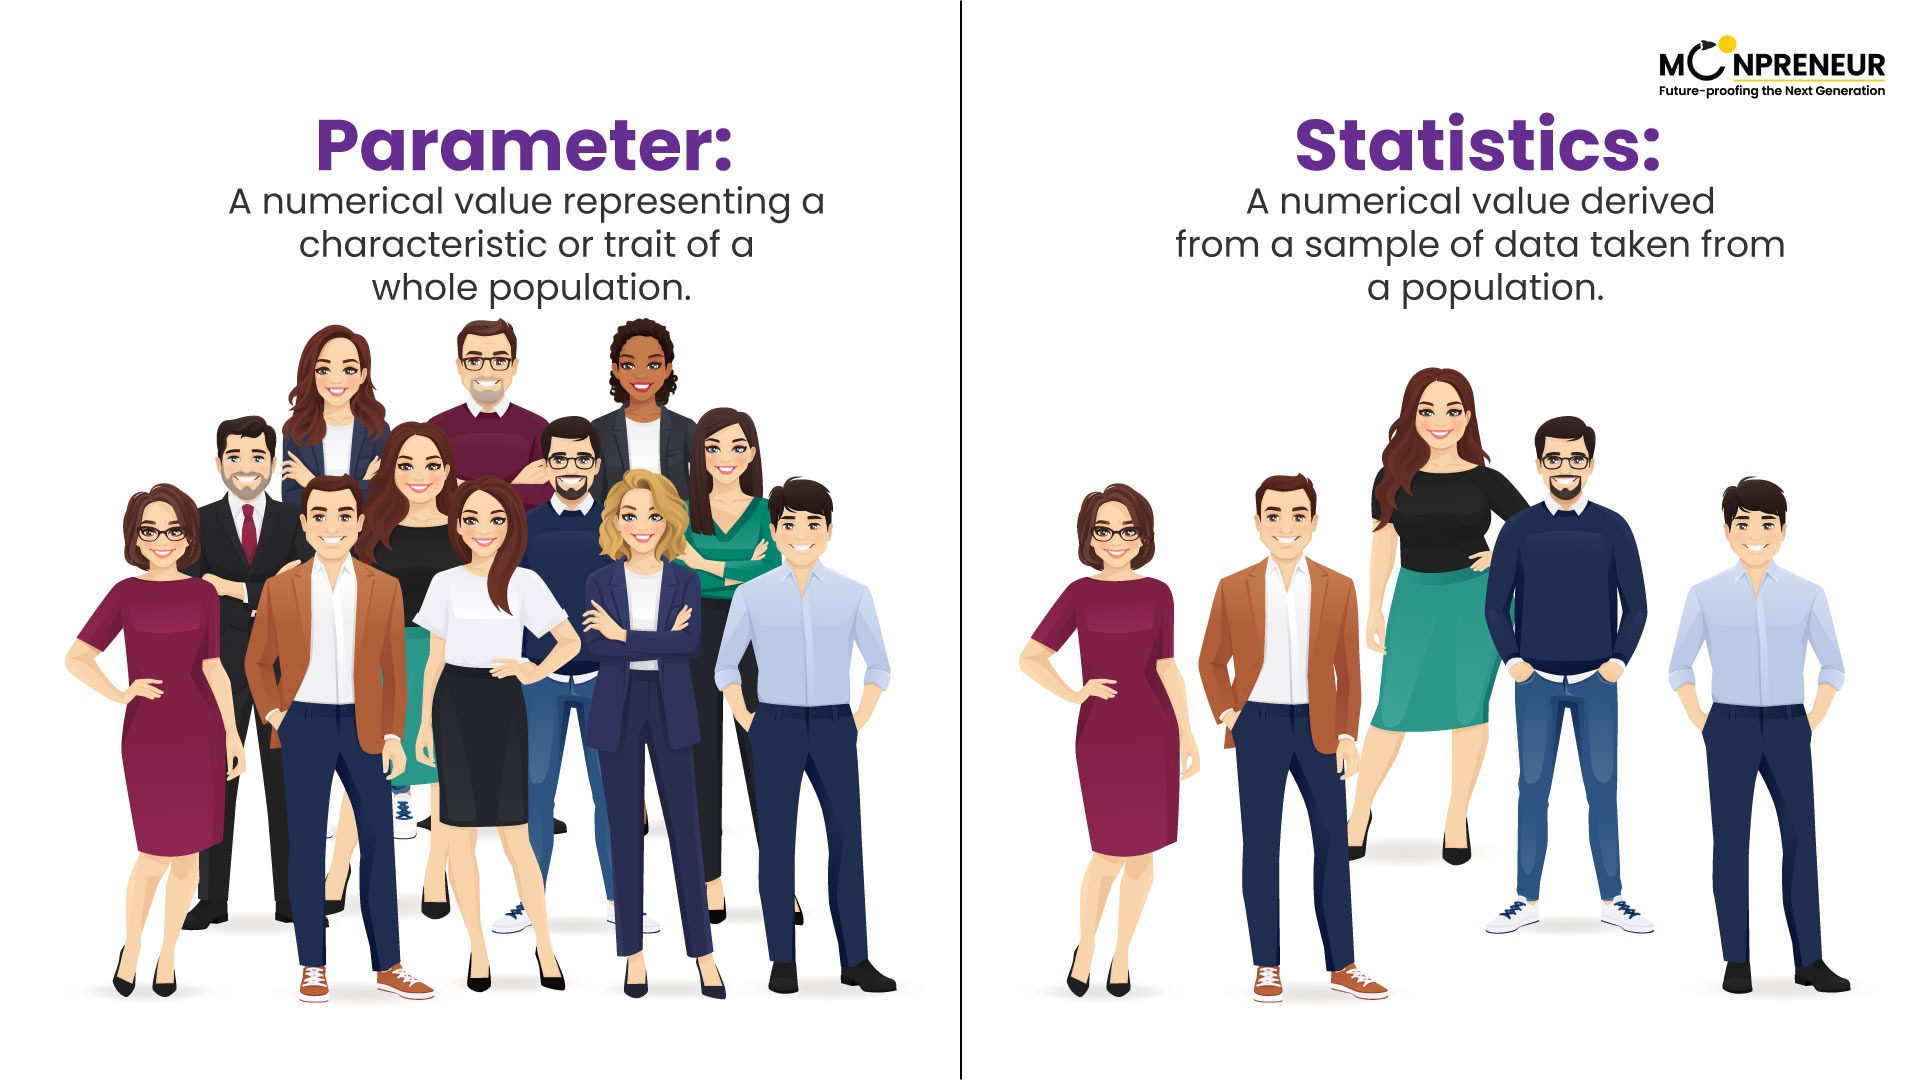
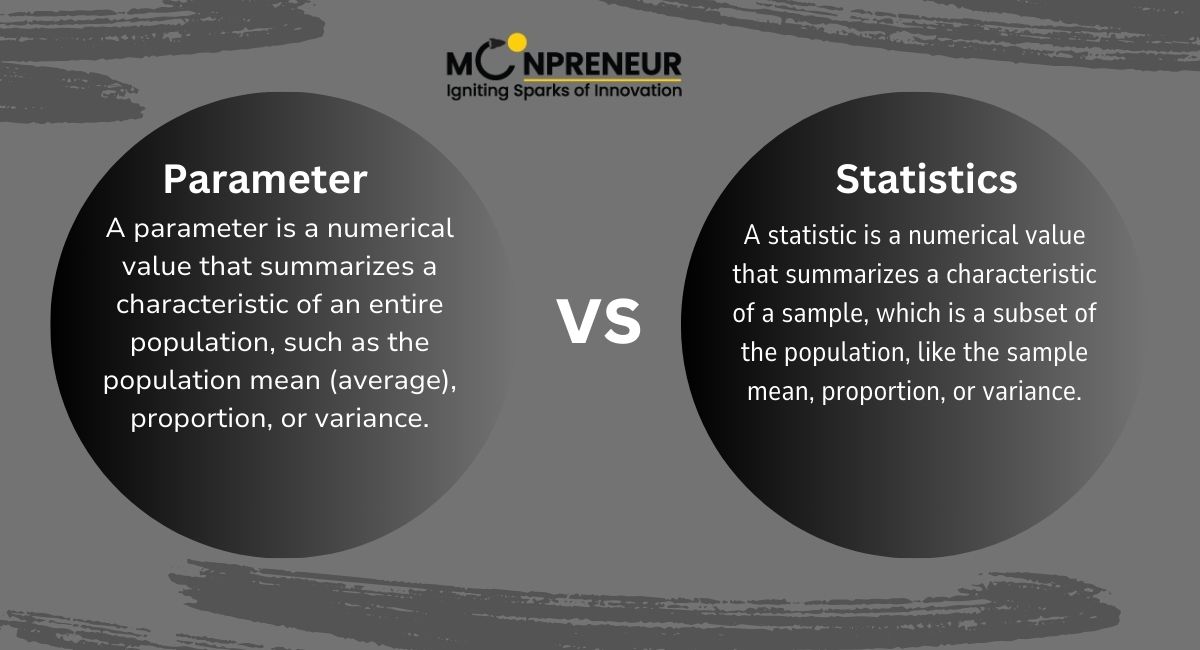
A parameter is a numerical value that describes a characteristic of an entire population. The population includes all possible subjects or data points that are of interest in a given study. For example, the average height of every adult in a country or the true percentage of voters who prefer a particular candidate are parameters. Since it is often impractical to measure an entire population, parameters are typically unknown and must be estimated through sampling.
Examples of Parameters:
- The average income of all households in the United States.
- The proportion of people in a country who own a car.
- The standard deviation of the weight of all apples grown in an orchard.
In practice, parameters are rarely measured directly. Instead, they are estimated using data collected from a smaller subset of the population, known as a sample.
Recommended Reading: An Introduction to Learning Management System (LMS)
What Is a Statistic?
A statistic, by contrast, is a numerical value that describes a characteristic of a sample, which is a subset of the population. Since gathering data from every member of a population is usually not feasible, researchers collect data from a representative group and calculate statistics. These statistics are then used to make inferences or educated guesses about the population parameter.
Examples of Statistics:
- The average income of 1,000 households surveyed in the United States.
- The proportion of 500 sampled voters who support a particular candidate.
- The standard deviation of the weight of 200 apples selected from the orchard.
Statistics are calculated directly from the sample data and used to estimate parameters. For example, if you wanted to know the average height of adults in a city, you would measure a sample of individuals, calculate the average height (a statistic), and use it to estimate the average height of the entire population (a parameter).
Recommended reading: Learn Roman Numerals – Basics, Worksheet, and More
Key Differences Between Parameter and Statistic
Here are the primary differences between parameters and statistics:
- Population vs. Sample: A parameter describes an entire population, while a statistic describes a sample.
- Theoretical vs. Measurable: A parameter is often theoretical and unknown, while a statistic is measured directly from the sample data.
- Greek vs. Latin Notation: Parameters are usually represented by Greek letters (e.g., μ for mean, σ for standard deviation), while statistics are represented by Latin letters (e.g., x̄ for mean, s for standard deviation).
- Fixed vs. Variable: A parameter is fixed for a population, but a statistic can vary from sample to sample, meaning that different samples from the same population may give slightly different statistics.
Why the Difference Matters
The distinction between parameters and statistics is critical for data analysis because statistics are used to estimate parameters. This process, known as statistical inference, is how researchers and analysts make predictions and decisions based on data. However, because samples can vary, statistics come with a degree of uncertainty. This uncertainty is often expressed through confidence intervals and margins of error, which indicate the range within which the true parameter is likely to fall.
Example of Statistical Inference:
Imagine you want to know the average number of hours people spend on their phones each day. Since it’s impractical to survey every person in the world, you collect data from a random sample of 500 people. You calculate that the average number of hours for this sample is 4.2 hours. This statistic (4.2 hours) is an estimate of the parameter (the true average for the entire population), but it’s not a perfect measure. By applying statistical techniques, you can calculate a confidence interval, which might indicate that you are 95% confident the true average lies between 4.0 and 4.4 hours.
Recommended reading: Latest College Admission Trends and Statistics
When to Use Parameters and Statistics
- Parameters are typically used in theoretical or large-scale population studies where you want to describe an entire group, such as the true voter turnout in an election or the exact percentage of people affected by a certain disease.
- Statistics are used in sample-based research, such as surveys, experiments, or smaller studies where it is impossible or impractical to measure every individual. For example, a marketing company might survey 1,000 customers to understand overall customer satisfaction levels.
Application in Business and Research
In fields like market research, economics, psychology, and medicine, understanding parameters and statistics is key to making data-driven decisions. Business analysts, for instance, may use sample data (statistics) to estimate the potential success of a new product (parameter). In healthcare, researchers might collect data from clinical trials (a sample) to estimate the effectiveness of a drug on the general population (a parameter).
Common Misconceptions Concerning Parameters and Statistics
Numerous individuals misinterpret the distinction between a parameter in statistics and a statistic, and as a result, provide wrong assumptions while analyzing data. Some of the common misconceptions are:
1. It is wrongly assumed that Sample Data is Same as Population Data
One of the biggest mistakes is believing that a sample perfectly represents the population. While a statistic (like an average calculated from a sample) is used to estimate a parameter in statistics, there is always some margin of error. Different samples may produce slightly different results.
2. Thinking a Parameter in Statistics Can Always Be Measured Directly
A parameter in statistics refers to a whole population, which is usually too big to be measured directly. For instance, the actual average income of all the people living in a country is a parameter in statistics, but it is not practical to collect data from millions of people. We use statistics from smaller representative samples to estimate it instead.
3. Assuming Larger Samples Always Ensure Accuracy
Although bigger samples tend to offer more accurate estimates of a parameter in statistics, they also do not eliminate bias. If the sample were not randomly selected or skewed in some fashion, then the statistic might not be a good estimate of the actual population parameter.
4. Overlooking Variability Among Samples
Different samples of the same population can provide different statistics. It is natural, therefore, that researchers utilize confidence intervals and significance testing to estimate a parameter in statistics by compensating for uncertainty.
If you grasp these fallacies, you will be able to better read data, eliminate analytical mistakes, and make wiser choices in research, commerce, and day-to-day life.
Test Your Understanding: Quick Quiz on Parameter in Statistics
Now that you have a good grasp of parameter in stats and stats, let’s check your knowledge with a quick quiz!
Question 1:
A researcher wants to know the average screen time of all teenagers in a country. Since surveying every teenager is impractical, they collect data from a sample of 1,500 teens and calculate the average screen time.
What is this calculated value called?
- A) Parameter
- B) Statistic
- C) Population
- D) Sample
Answer: B) Statistic
Question 2:
Which of the following is an example of a parameter in statistics?
- A) The average income of 5,000 randomly selected employees in a company.
- B) The true average height of all adults in a country.
- C) The proportion of 1,200 surveyed voters who support a candidate.
- D) The average test score of 200 students selected from a university.
Answer: B) The true average height of all adults in a country.
Question 3 (True/False):
A parameter in statistics is always calculated directly from data.
Answer: False. A parameter in statistics describes an entire population and is usually estimated using sample statistics.
By answering these questions, you can check how well you understand the difference between a parameter in statistics and a statistic. Keep practicing to strengthen your data analysis skills!
Conclusion
In conclusion, parameters and statistics are building blocks of data analysis and research. Parameters refer to entire populations and are mostly unknown, while statistics are quantitative values calculated from samples that are utilized to make an estimate of these parameters. The difference between the two words must be known to interpret data, make proper conclusions, and inform decisions.
By understanding this difference, you can improve your skill at analyzing data better, whether you’re doing research, making business choices, or reading scientific studies.
Seeking an all-around guide to parenting to make sure that you are heading in the right direction? Visit a treasure of parenting knowledge and learning in Moonpreneur’s blogs.
You may also join our programs that build the next generation of innovators. Book your free trial today!


Refine statistical methods, leading to better estimates of parameters and more informed decision-making, With advancements like AI and machine learning. It’s fascinating to see how technology can enhance statistical analysis, making it easier to gather more accurate data from larger and more diverse samples.
When I’m reading through this information, one question keeps popping into my mind: Is that number a parameter or a statistic?
“yes” to both questions, it’s likely a parameter. For smaller groups, it makes sense that I can gather data from everyone and summarize it as a parameter. But if I find myself saying “no” to either question, then it’s probably just a statistic. It’s a simple yet effective way to understand the difference.