

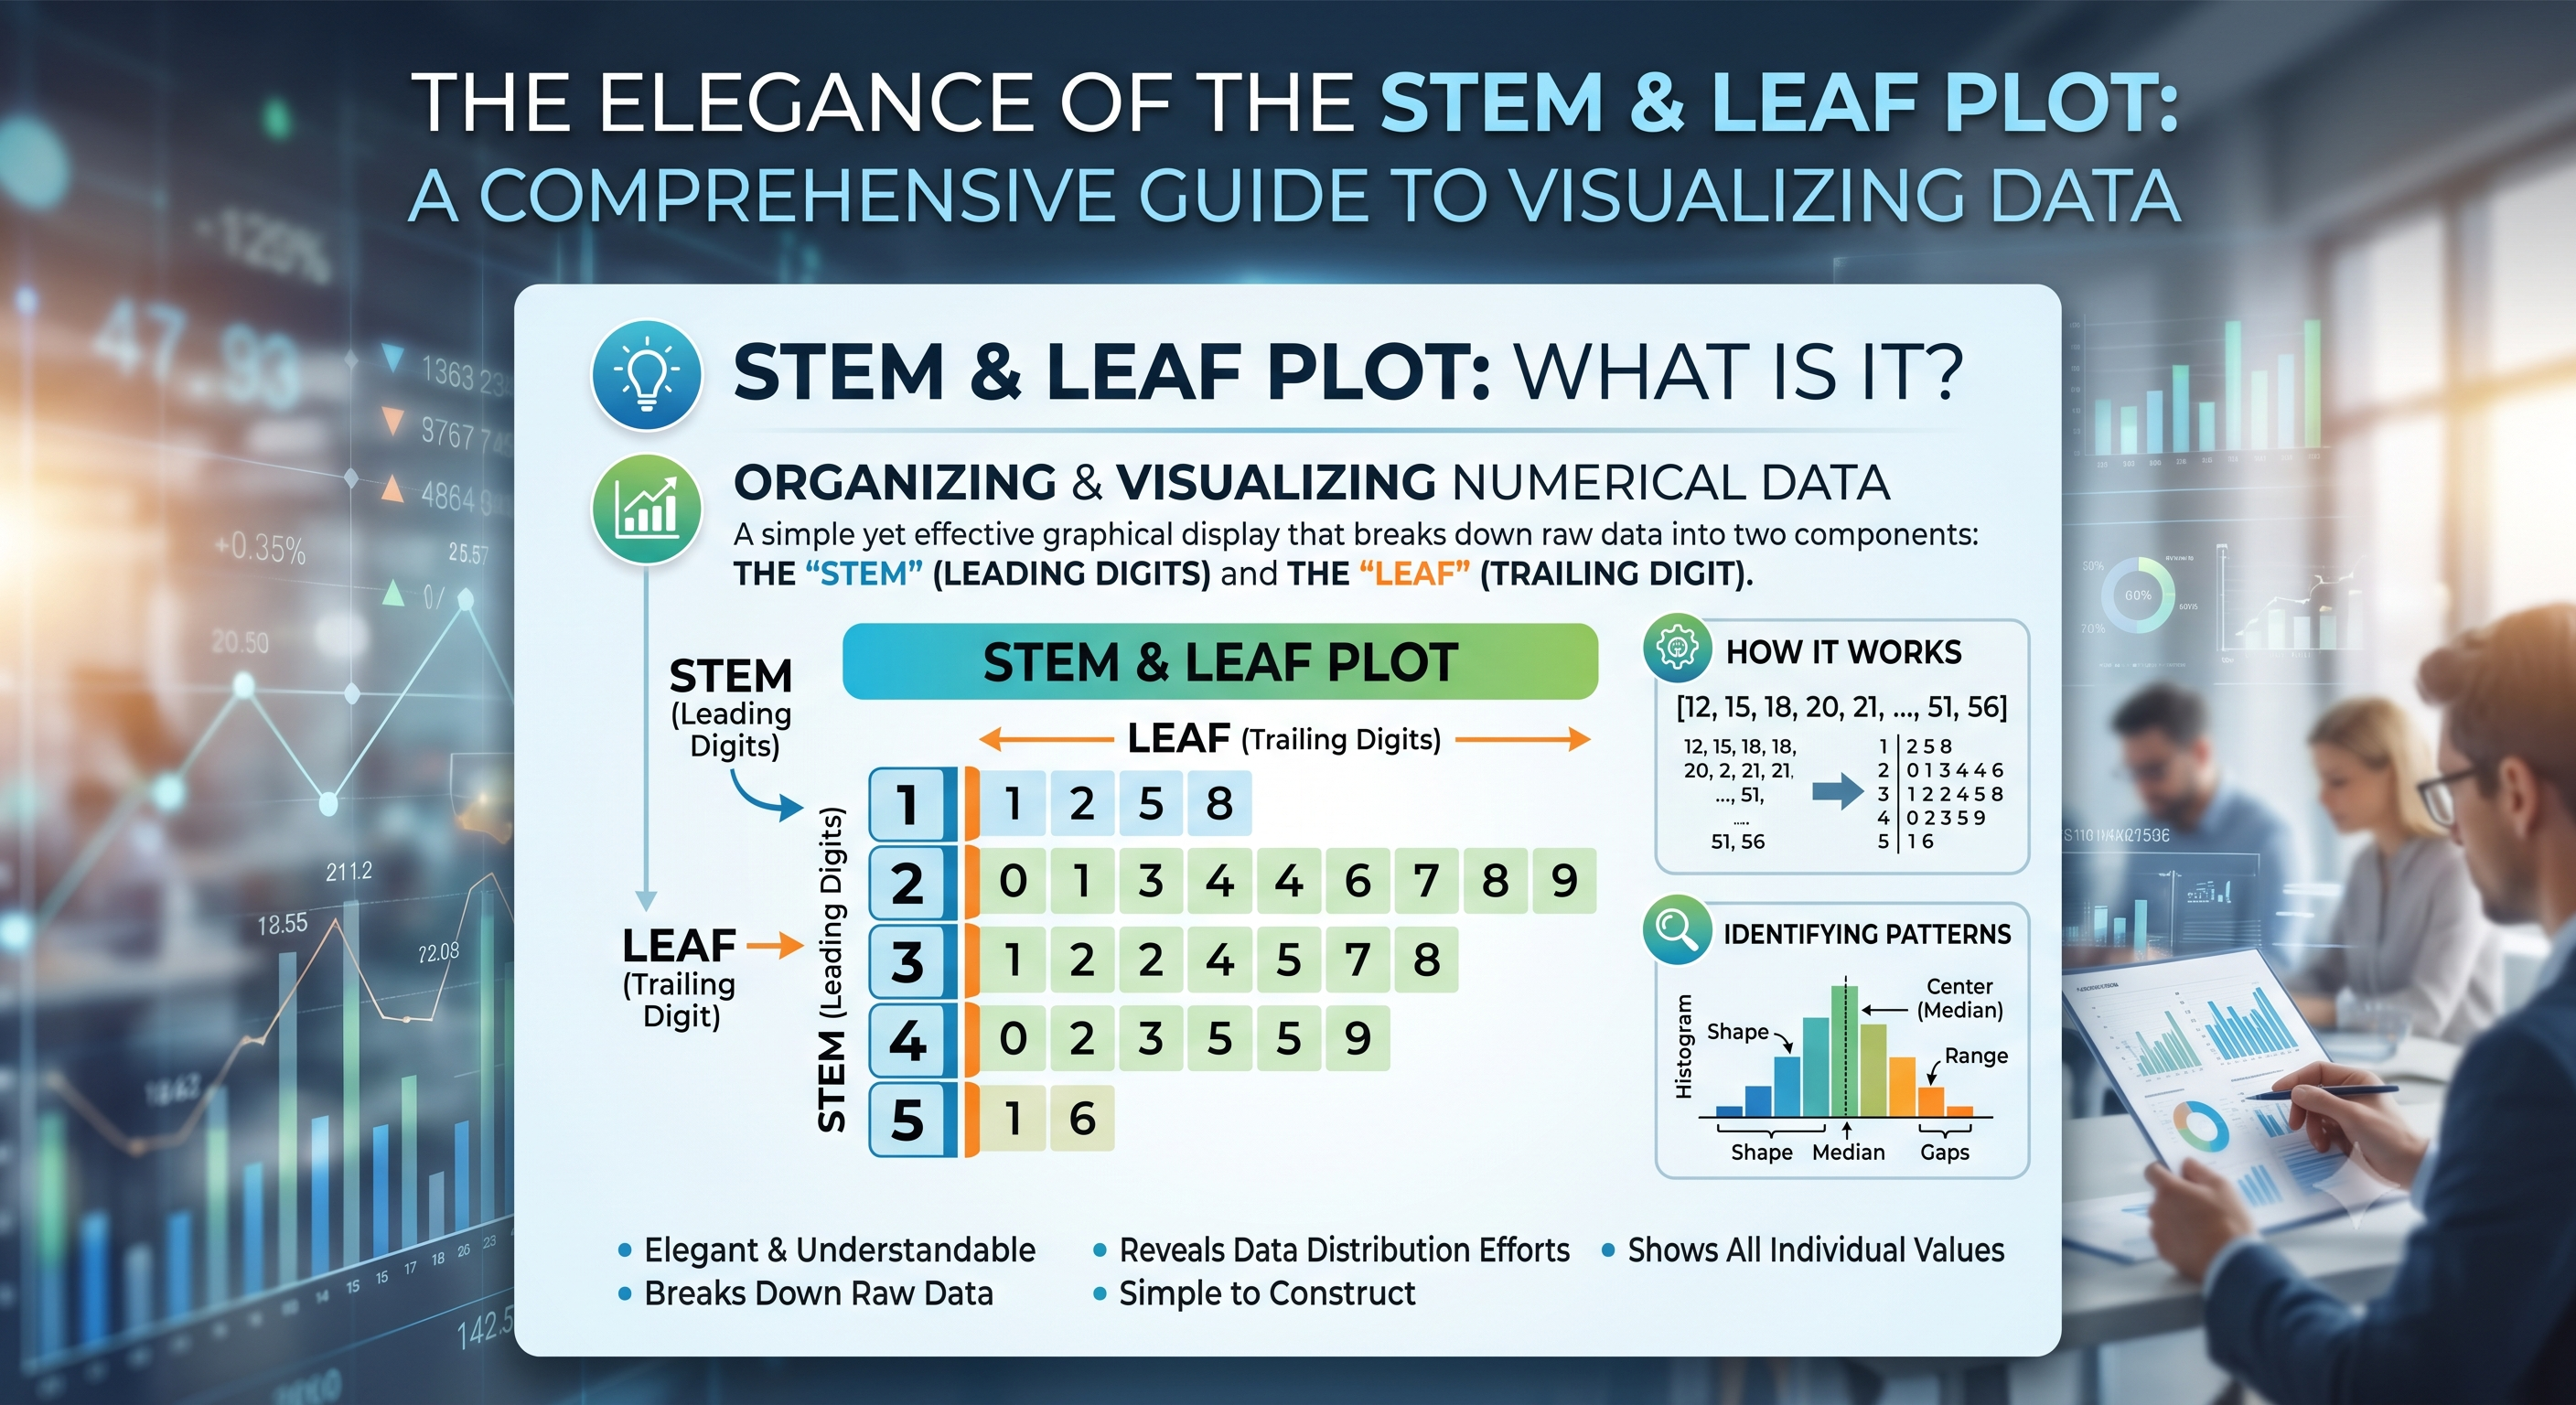
When it comes to organizing and visualizing data, a stem and leaf plot is one of the most elegant and understandable methods available. If you've ever wondered 'What is a stem and leaf plot?' or struggled to make sense of raw numerical data, this comprehensive guide will illuminate how this powerful statistical tool works and why it's invaluable for data analysis. A stem and leaf plot is a simple yet effective graphical display that breaks down numerical data into two components: the 'stem' (the leading digits) and the 'leaf' (the trailing digit). This method revolutionizes how we perceive data distribution and makes identifying patterns almost effortless.
Understanding the Stem and Leaf Plot: The Basics
A stem and leaf plot, often referred to as a stem-and-leaf plot, is a method of organizing data that separates each number into a ‘stem’ (typically all but the last digit) and a ‘leaf’ (the final digit). This technique allows statisticians, students, and data analysts to visualize the distribution of numerical data at a glance while retaining the actual data values.
Key Components:
- Stem: The digits on the left side representing larger place values (tens, hundreds, etc.)
- Leaf: The digits on the right representing the units place (ones digit)
- Stem-and-Leaf Separator: A vertical line distinguishing stem from leaf sections
Recommended Reading: What is 0.6 as a Fraction
How Does a Stem and Leaf Plot Work?
Understanding how to read and construct a stem and leaf plot is simpler than you might think. Here’s the step-by-step process:
- Organize Your Data: Arrange your numerical data in ascending or descending order
- Identify Stems: Determine the ‘stem’ value (all digits except the last one)
- Extract Leaves: Identify the ‘leaf’ value (the last digit of each number)
- Arrange: Place stems in a vertical column, then write leaves horizontally next to each stem
Stem and Leaf Plot Examples
Let's examine practical stem and leaf plot examples to better understand this concept.
Example 1: Student Test Scores
Example 2: Temperature Data
✨ Advantages of Using a Stem-and-Leaf Plot
🎯 When Should You Use a Stem and Leaf Plot?
Stem-and-leaf plots work best in these scenarios:
⚠️ Limitations to Consider
Large Datasets
Becomes unwieldy with hundreds or thousands of data points.
Decimal Values
More challenging when data contains many decimal places.
Single Dimension
Shows only one variable at a time.
Recommended Reading: How to Use the Sridharacharya Formula to Solve Quadratic Equations
Conclusion
Understanding ‘what is a stem and leaf plot’ opens up a world of data analysis possibilities. This simple yet powerful visualization technique transforms raw numbers into meaningful patterns that are easy to interpret and analyze. Whether you’re a student learning statistics, a teacher explaining data concepts, or a professional analyzing information, mastering the stem and leaf plot is an invaluable skill.
From our stem and leaf plot examples to the step-by-step construction methods, you now have all the tools needed to create and interpret these plots effectively. Remember, the beauty of a stem-and-leaf plot lies in its simplicity and its ability to reveal data stories that might be hidden in spreadsheets or raw lists.
Start practicing with real datasets today, and you’ll discover why statisticians and educators continue to value this elegant data visualization method.
You can opt for our Advanced Math or Vedic Math+Mental Math courses. Our Math Quiz for grades 3rd, 4th, 5th, and 6th helps in further exciting and engaging in mathematics with hands-on lessons.