Attend our in-person Robotics & Math


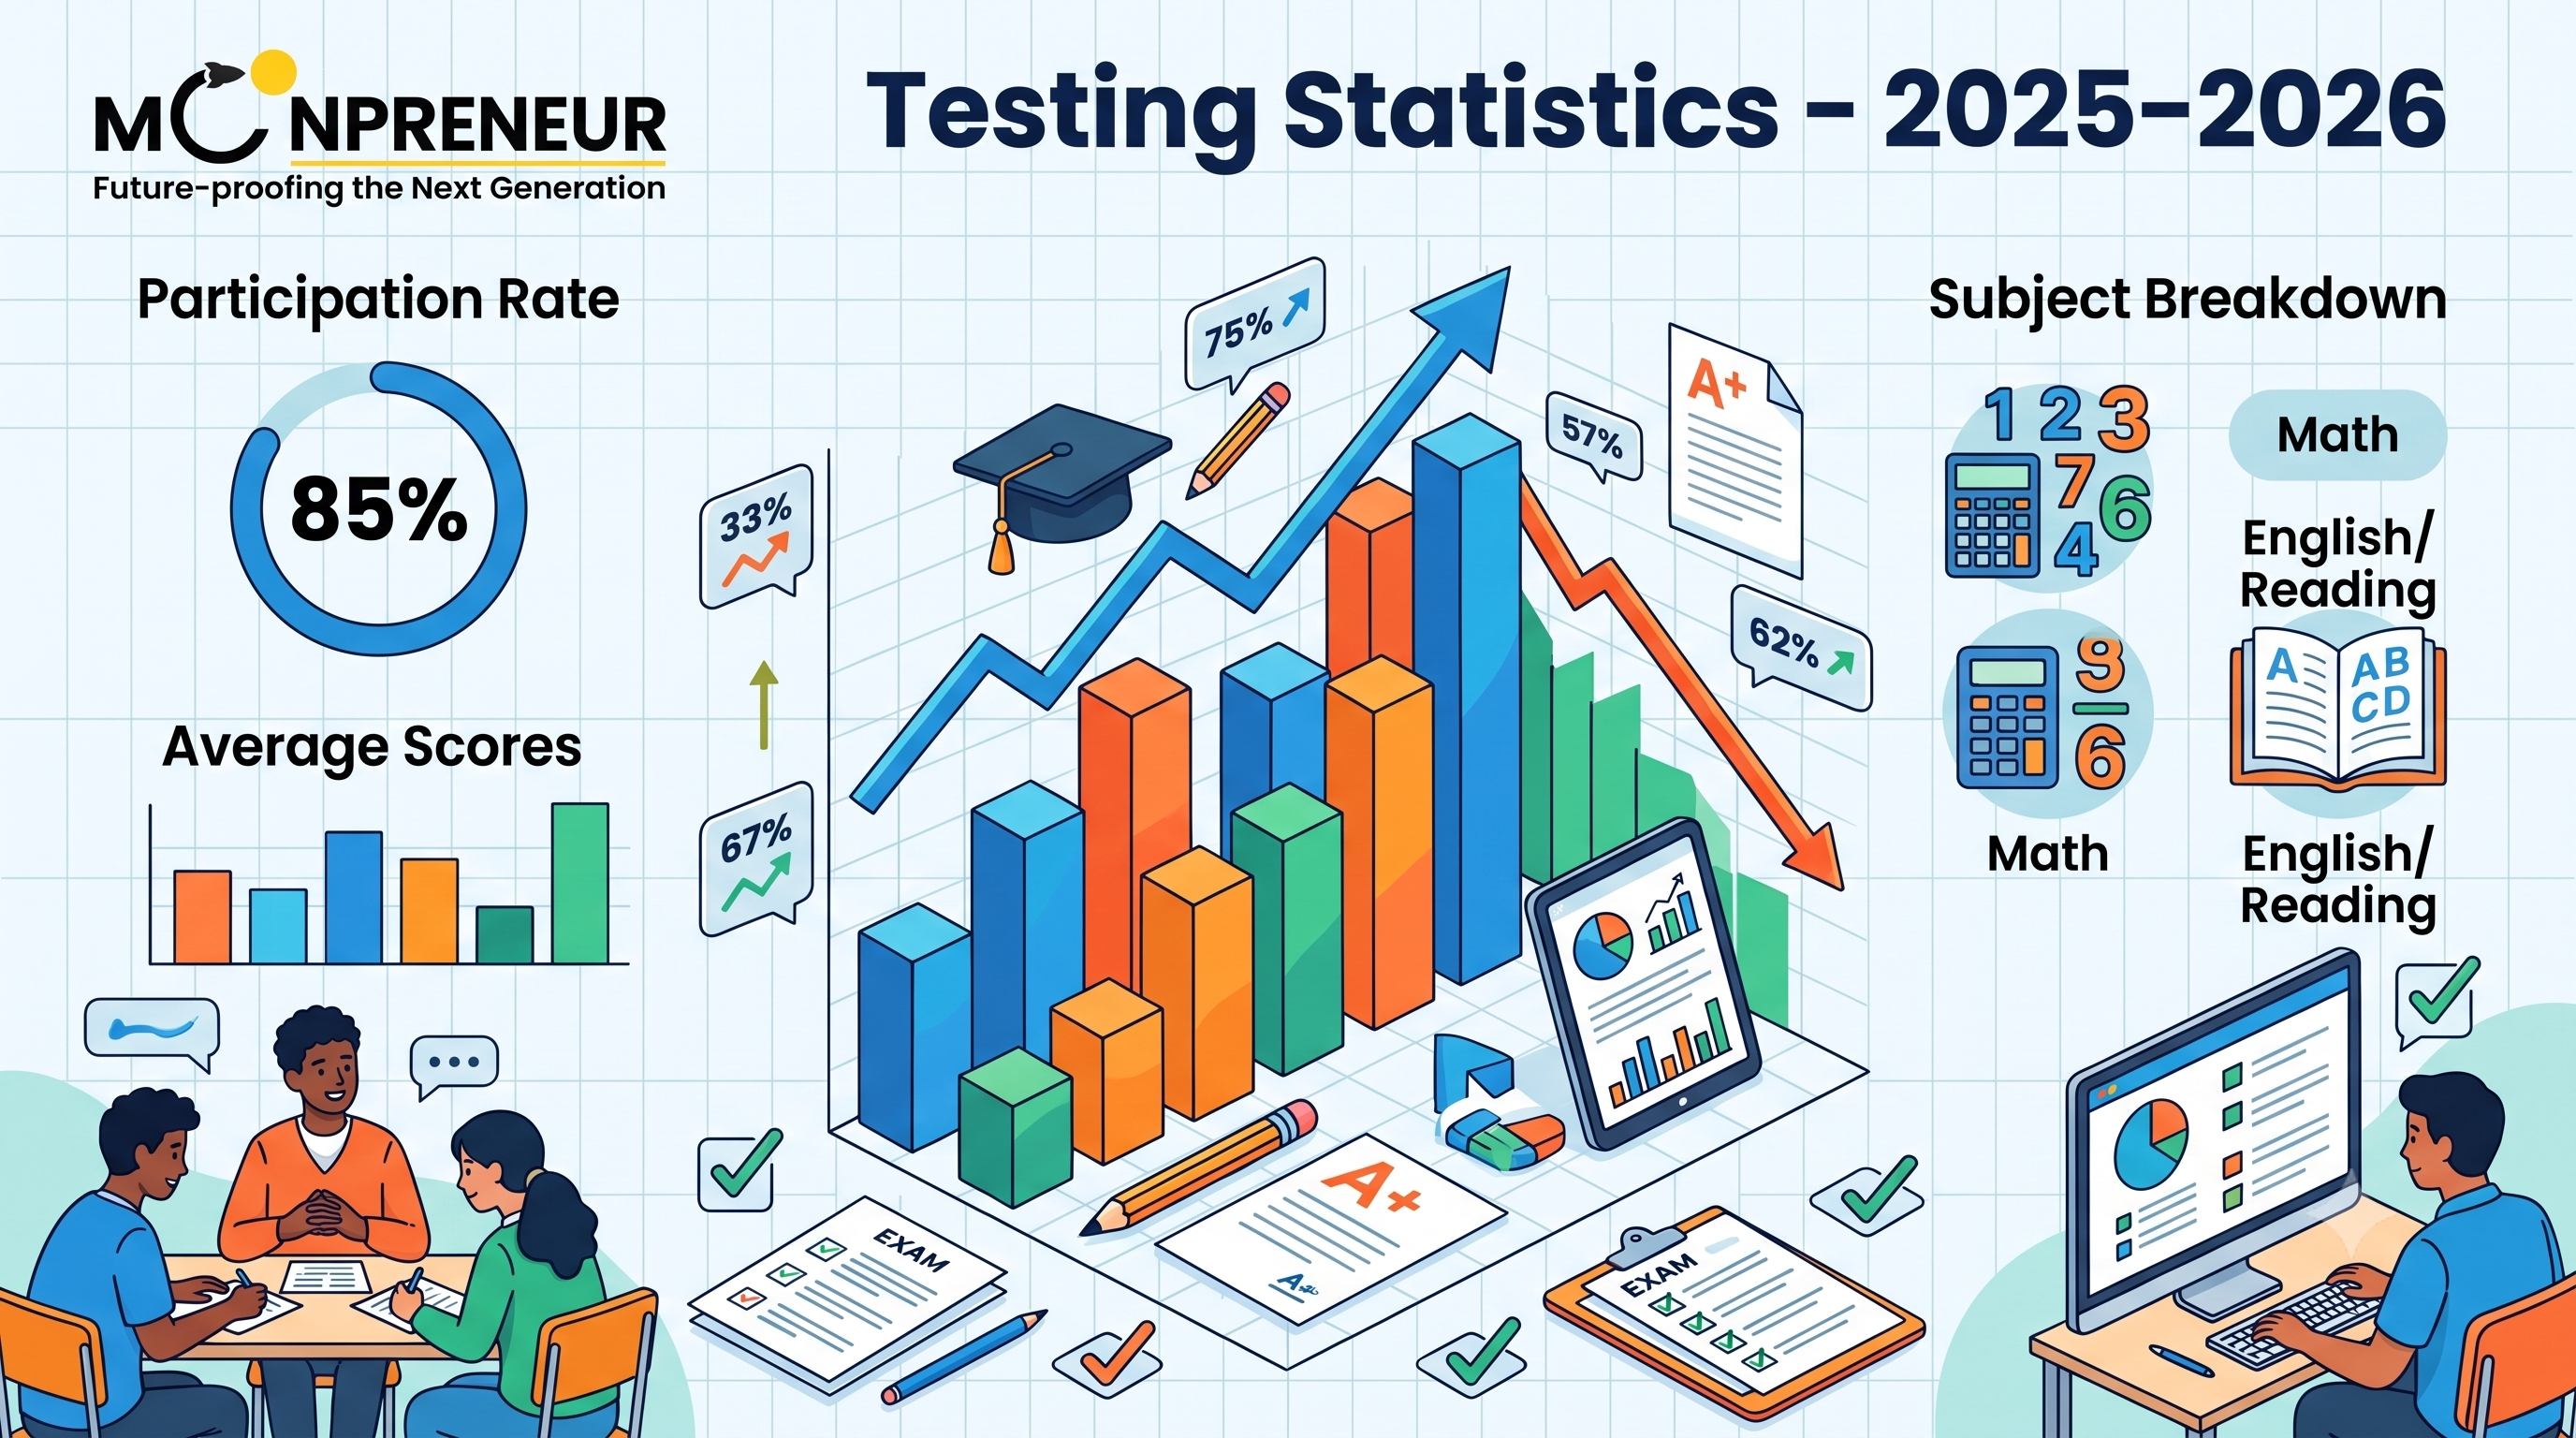
Standardized testing statistics show that over 80% of four-year colleges in the United States operate under test-optional or test-blind admissions policies for the 2025–2026 academic cycle.
While standardized exams like the SAT and ACT have historically served as universal metrics for academic achievement, modern data highlight growing score disparities linked directly to household income, race, and access to test preparation.
Make Math More Exciting for Your Child
Help your child build confidence in math through fun, engaging lessons designed to strengthen core concepts and problem-solving skills with Moonpreneur: Explore the Advanced Math Program →
Standardized Testing Statistics – 2025–2026
Standardized testing statistics highlight a defining era of transformation in American education. As high schools and universities reevaluate how student performance is measured, empirical data provides valuable insights into the efficacy, equity, and future of standardized exams.
Whether evaluating college readiness or assessing equity gaps, examining statistics on standardized testing offers a clear picture of how tests like the SAT, ACT, and state assessment exams impact millions of students nationwide.
Key Overview: Standardized Testing by the Numbers
To understand the scope of standardized testing today, examine the baseline metrics governing high school and college assessments:
- Annual Test Takers: Approximately 1.9 million students take the SAT and 1.4 million take the ACT annually.
- Test-Optional Institutions: Over 1,900 four-year colleges do not require test scores for admissions in 2025–2026.
- Economic Footprint: The U.S. testing and prep industry generates over $1 billion in annual revenue.
- Average SAT Score: The national average SAT composite score remains centered around 1028.
- Average ACT Score: The national average ACT composite score stands at 19.4.
Statistics About Standardized Testing Being Bad for Equity
A major driver behind the shift away from mandatory exams is the body of statistics about standardized testing being bad for student equity. Comprehensive data from the College Board and National Center for Fair & Open Testing (FairTest) demonstrates a strong correlation between family income and test performance.
| Household Income Tier | Average SAT Score | Score Variance vs. National Average |
|---|---|---|
| Below $20,000 | ~930 | −98 Points |
| $20,000 – $60,000 | ~990 | −38 Points |
| $60,000 – $100,000 | ~1050 | +22 Points |
| Above $100,000 | ~1150 | +122 Points |
These statistics on why standardized testing is bad for low-income demographics show that score outcomes frequently mirror access to expensive test preparation courses, private tutoring, and repeated retakes rather than innate academic capability.
Do Standardized Test Scores Predict College Success?
Educational researchers continuously evaluate how well standardized tests predict post-secondary success compared with High School Grade Point Average (HSGPA).
1. Cumulative High School GPA
High school GPA reflects four years of consistent academic work, study habits, and self-regulation.
Data consistently shows that HSGPA is 2x to 3x more accurate at predicting college graduation rates than standardized test scores alone.
2. Standardized Test Scores
Test scores show a moderate correlation with first-year college GPA, but their predictive power drops significantly when measuring four-year degree completion.
Admissions officers often find that combining HSGPA with test scores offers a more complete academic profile, leading several top-tier universities to selectively reintroduce testing requirements.
The Rise of Test-Optional Policies in 2025–2026
When evaluating statistics about standardized testing, the rapid adoption of test-optional policies represents one of the most significant structural changes in college admissions.
Growth of Test-Optional Colleges
Colleges that transitioned to test-optional policies experienced an average increase of 15% to 30% in overall application volume.
Institutions adopting test-optional policies saw an average 10% to 20% increase in enrollment among underrepresented minority and first-generation college students.
Conclusion
The nature is abundant with amazing patterns and the mathematics provides a tool for comprehending them all. Whether it is a pattern of a sunflower, a butterfly’s symmetric design or a hexagonal construction of a bee hive, nature patterns math prove that math can be seen not only in the classroom.
Next time you go out, have a look around carefully and you will find out that the tree, the flower, the shell or even an animal standing in front of you hides a mathematical pattern inside itself.
You can opt for our Advanced Math or Vedic Math+Mental Math courses. Our Math Quiz for grades 3rd, 4th, 5th, and 6th helps in further exciting and engaging in mathematics with hands-on lessons.
Frequently Asked Questions
What do statistics on standardized testing show about high-stakes stress?
Research indicates that over 60% of high school students report severe test anxiety related to standardized exams, which can negatively suppress actual academic performance on test day.
Why are some universities returning to required standardized testing?
Certain institutions report that test scores help identify high-achieving students from low-income schools whose high school grading standards might otherwise be difficult to benchmark.
What is the average time spent on standardized testing in public schools?
On average, American public school students take 112 standardized tests between kindergarten and 12th grade, totaling roughly 20 to 25 hours of testing per academic year.