

In the world of statistics and data visualization, a histogram is an essential tool for understanding how data is distributed. One common and important shape you may encounter is a right-skewed histogram, which can provide valuable insights into the underlying patterns within your data.
In this article, we will explain exactly what a right-skewed histogram is, how to identify one, and what its shape tells you about your data. We will also explore its role in data analysis using clear explanations and practical examples.
What Does a “Right Skewed Histogram” Mean?
A histogram displays the distribution of a single numerical variable by grouping data into ranges (called bins or intervals) and representing the frequency of data points in each range with a bar. The height of each bar corresponds to the frequency or relative frequency of that range.
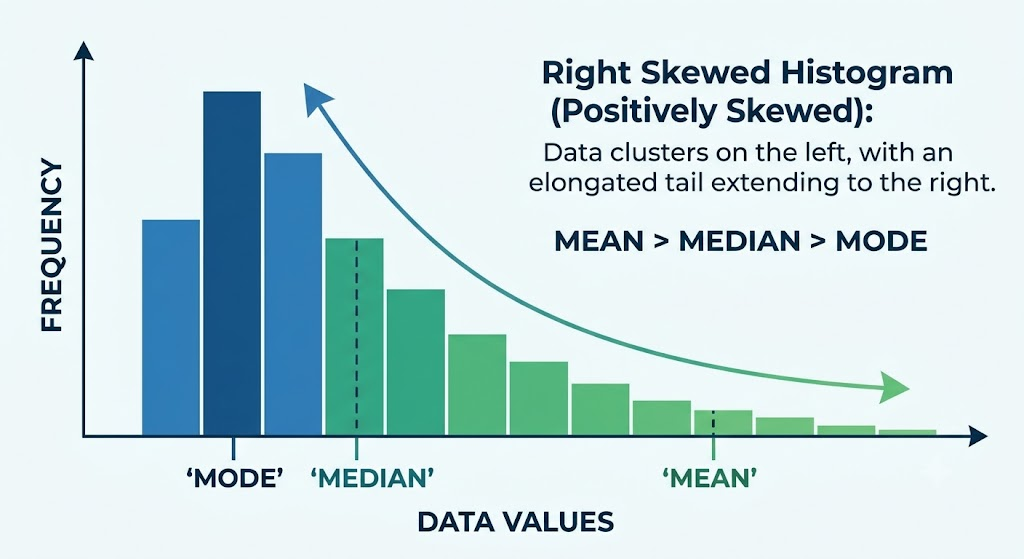
When a histogram is symmetrical, its shape resembles a bell curve, with the most frequent data points centered. A right-skewed histogram is the opposite of symmetrical. It's a type of frequency distribution where the long tail extends to the right side of the graph, towards the higher data values.
Think of it this way:
- The peak (mode) of the data is concentrated on the left.
- As you move right, the frequencies taper off, forming a "tail" that is pulled out.
Another common term for this pattern is a skewed right histogram or a histogram skewed right. This "skew to the right" indicator is essential because it immediately tells you that the data is not normally distributed and that a handful of very large values are dragging the average higher than the median or mode.
How to Identify a Histogram Skewed Right
How to Identify a Right-Skewed Histogram
Visually identifying a right-skewed pattern is straightforward. Here’s what you should look for:
- Concentrated Data on the Left: Most of the data values are clustered on the lower end of the variable's range. This creates a steep, high bar or a cluster of high bars on the left side.
- Long Right Tail: As the data values increase along the horizontal axis, the bars become progressively shorter and less frequent. This creates an elongated, thin tail extending towards the larger numbers.
-
Mean, Median, and Mode Order:
The single most reliable indicator is the relationship between the three common
measures of central tendency. In a skewed to the right histogram,
they generally fall in this specific order, with the mean being the highest:
Mode < Median < MeanThe few high-value outliers (extreme values in the right tail) pull the mean, but have much less effect on the median, and no impact on the mode.
Insert the generated infographic image showing a clear right-skewed histogram with labels for the long tail, mean, median, and mode, as designed.
Examples of Right Skewed Distributions
You are more likely to encounter a right-skewed histogram in real-world data than you might expect. Several types of data naturally have more values concentrated toward the lower end, with a smaller number of unusually high values creating a long tail to the right. Here are some common examples:
Income
Most people earn a middle-range or lower income, creating a concentration of values toward the left side of the histogram. A small number of very wealthy individuals produce high-income outliers that extend the distribution to the right. As a result, the mean income is often higher than the median income.
House Prices
Many properties are priced within a typical range, while a smaller number of high-end luxury homes have much higher prices. These expensive properties create a long right tail, making the distribution right-skewed.
Website Traffic (Page Views)
Most pages on a website may receive a relatively small number of views, while a few highly popular articles or pages can receive significantly more traffic. These high-traffic pages create a right-skewed distribution.
Age of Business Failures
Many businesses may fail within their first few years, creating a concentration of values at a lower age. A smaller number of businesses survive for much longer, producing a longer tail toward higher values.
Customer Service Hold Time
Many customer service calls may be answered within a short period, while some callers experience extremely long waiting times. These unusually long wait times extend the distribution to the right and can create a right-skewed histogram.
Conclusion:
A right-skewed histogram is a fundamental pattern to recognize in data analysis. It indicates that a distribution is not symmetrical and has a longer tail toward higher values. This pattern suggests the presence of extreme values on the higher end, which can significantly affect how the data is interpreted.
When you encounter a right-skewed histogram, it is essential to understand the following:
- The standard mean may not be the most reliable measure of a typical data point. The median is usually a more representative measure of the center.
- Using standard statistical methods designed for normally distributed data can sometimes lead to misleading conclusions.
- Identifying and analyzing the outliers in the long tail can provide valuable insights, such as understanding who the highest spenders are or why certain processes take unusually long.
By understanding the visual and statistical characteristics of a right-skewed histogram, you can gain more accurate insights and make better-informed decisions from your data.
You can opt for our Advanced Math or Vedic Math+Mental Math courses. Our Math Quiz for grades 3rd, 4th, 5th, and 6th helps in further exciting and engaging in mathematics with hands-on lessons.